Independent Study
AI Platform Visual Output Evaluation
Independent research by Blair Little comparing first-pass outputs from Claude, ChatGPT, Gemini, and Grok. The study measured visual style, historical accuracy, prompt relevance, completeness, global representation, readability, and format innovation using a weighted scoring rubric.
TL;DR
Claude won because it treated the request like an information design problem and produced an interactive HTML deliverable with global coverage and high factual depth. Gemini was the best static infographic. ChatGPT made the best-looking image, but not the most trustworthy one. Grok showed the clearest failure mode for image-based diagrams: if text rendering breaks, the whole visual stops being reliable.
Source files: this article is based on the original evaluation assets and the full PDF report. Open the full report (PDF) or open Claude's interactive HTML output.
Test Prompt and Method
The test used one prompt only, with no follow-up, no prompt engineering, and no platform-specific tooling: Create a diagram that represents Civilisation Timeline over the past 1000 years.
That constraint matters. It reflects the typical first-pass user experience, where someone asks directly for a diagram and expects the platform to decide how that should be represented. Each tool responded in its native default mode: Claude returned HTML and JavaScript, ChatGPT and Gemini returned static PNGs, and Grok returned a JPEG.
| Method step | What was held constant | Why it matters |
|---|---|---|
| Prompting | Exactly the same prompt text for all four platforms | Removes prompt engineering as the explanation for performance gaps |
| Capture | Native first-pass output only | Measures what a normal user gets without iteration |
| Scoring | Seven weighted criteria scored from 0 to 10 | Balances aesthetics against accuracy, clarity, and depth |
| Scope | Historical communication over a 1000-year time range | Tests whether visual AI can handle chronology and civilisation framing together |
Comparative Scorecard
| Criterion | Weight | Claude | ChatGPT | Gemini | Grok |
|---|---|---|---|---|---|
| Visual Style | 1x | 9 | 9 | 8 | 6 |
| Historical Accuracy | 1.5x | 9 | 6 | 8 | 4 |
| Prompt Relevance | 1.5x | 10 | 7 | 9 | 6 |
| Completeness and Depth | 1.5x | 10 | 5 | 7 | 5 |
| Global Representation | 1x | 10 | 6 | 6 | 5 |
| Readability and Clarity | 1x | 8 | 7 | 9 | 4 |
| Format Innovation | 1x | 10 | 7 | 7 | 5 |
| Weighted total | 80.5 / 77 | 56.0 / 77 | 66.0 / 77 | 42.5 / 77 | |
| Percentage | 94.7% | 65.9% | 77.6% | 50.0% |
#1
Claude
Highest depth, strongest global representation, and the only output that became a genuinely usable interactive diagram.
#2
Gemini
Best static infographic structure with strong readability, but still constrained by Western framing and a few duplicated or debatable labels.
#3
ChatGPT
Best visual style, but factual slips and shallow content made it much weaker as an informational diagram than it first appears.
#4
Grok
Century layout was promising, but garbled text and low legibility made the output too unreliable for serious historical communication.
What Each Platform Actually Produced
Claude turned the prompt into a browser-based information product
Claude interpreted the request as something closer to data visualisation or front-end engineering than pure image generation. The output uses a multi-lane regional timeline, hover tooltips, and a 1000-2026 axis, with six region groups and a far denser historical layer than the image-based competitors.
Strengths: depth, global coverage, interactivity, and high prompt fidelity. Weakness: it is less portable than a static image and depends on browser rendering.
ChatGPT made the most attractive image, not the best diagram
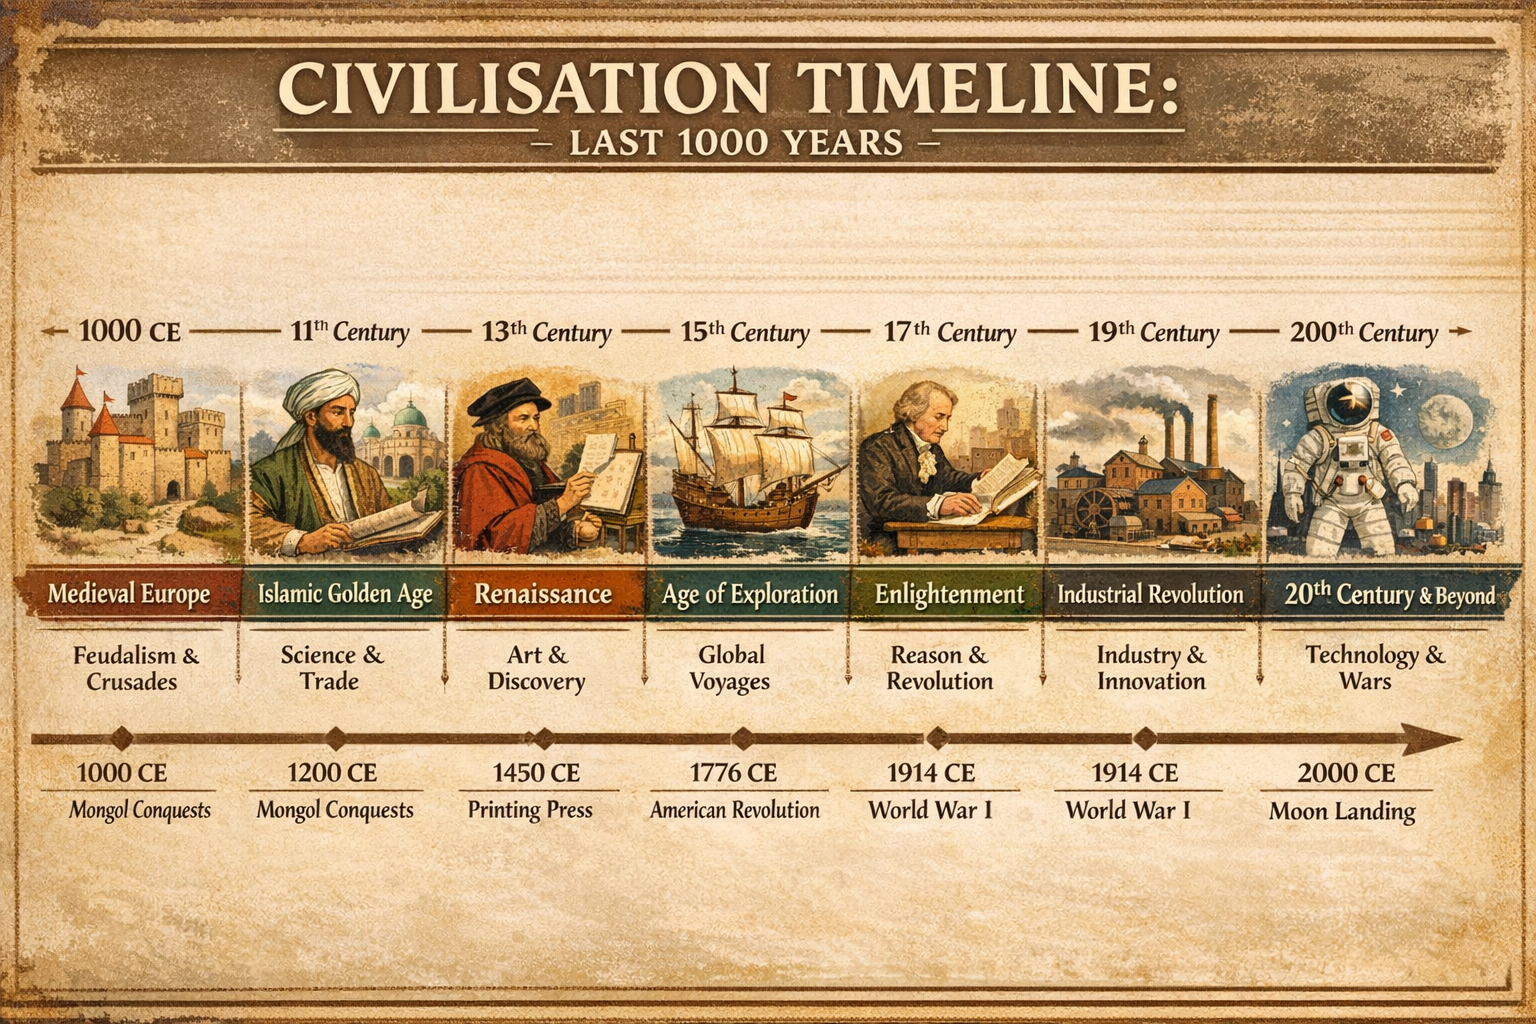
The parchment treatment is visually strong and immediately legible at a glance, but the information quality breaks under inspection. The axis includes a 200th Century rendering error, the Mongol conquests are placed at 1000 CE, and World War I appears twice.
Gemini delivered the cleanest static infographic structure
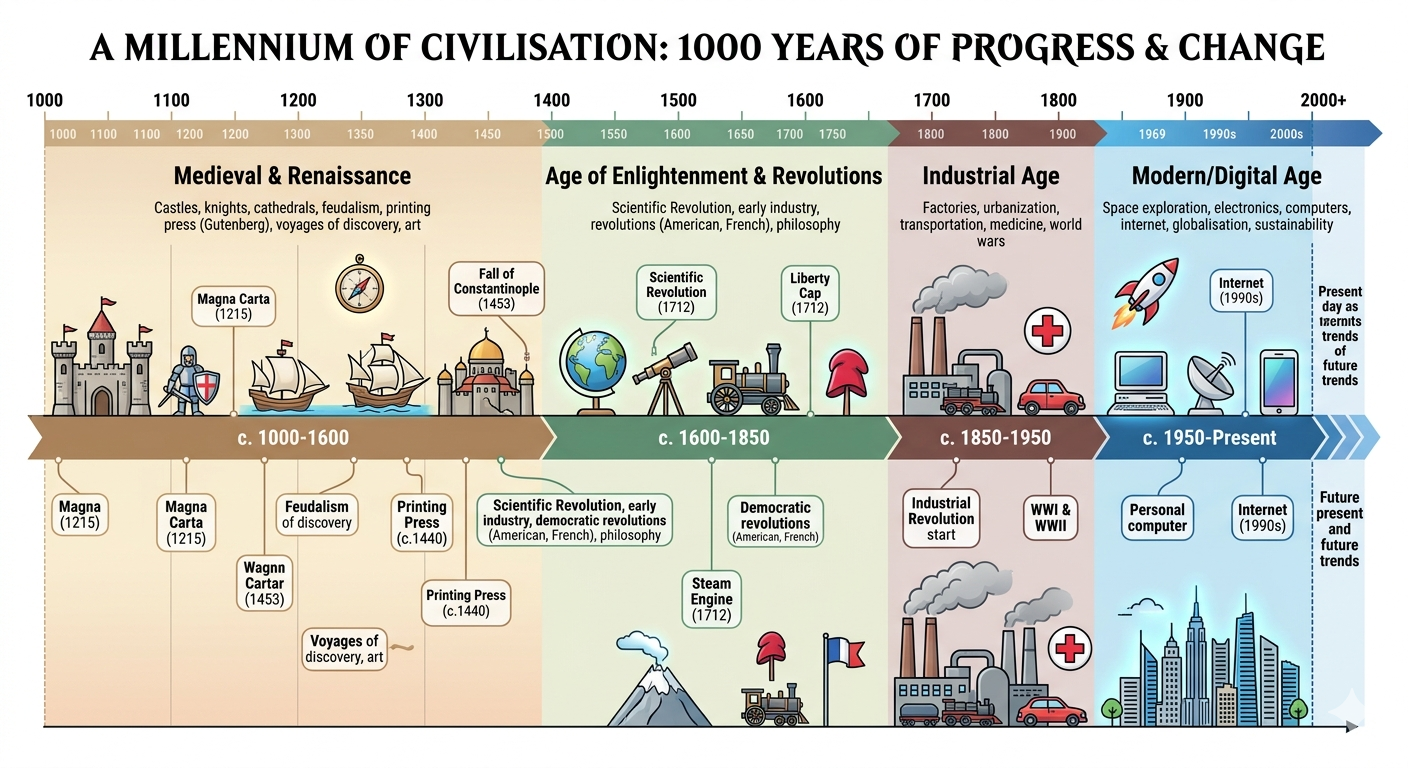
Gemini's dual-track layout makes it the easiest static output to scan. Era bands, event callouts, and icon consistency all work well. The trade-off is narrower world coverage and some content duplication, including repeated Magna Carta and Printing Press references.
Grok exposed the text-rendering failure mode most clearly
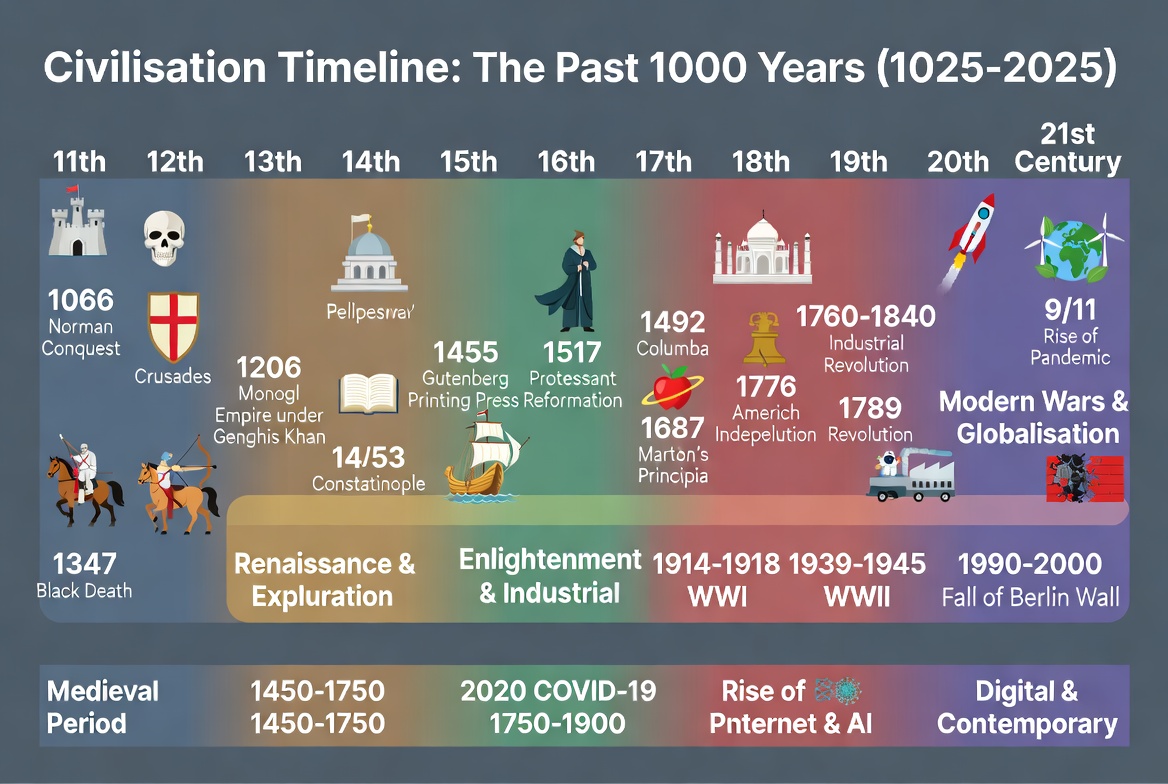
There is a real idea here: a century-by-century structure with broad historical transitions. But label degradation damages the entire diagram. Garbled text such as Pellpesrray, Monogl, and Americh Indepelution means the viewer cannot trust the content without external verification.
Four Findings That Matter Beyond This One Test
01
Format interpretation matters as much as model capability
Claude won in part because it redefined the task. It did not just paint a picture of history. It built a navigable interface for historical information.
02
Visual quality is a poor proxy for truth
ChatGPT's result looks polished enough to be trusted, which is exactly why its factual slips matter. Beautiful misinformation is still misinformation.
03
Text rendering remains a major weakness in image-led outputs
When a diagram depends on labels, dates, and named events, text corruption is not a small artifact. It is a structural failure that collapses the whole informational purpose.
04
Global representation still requires deliberate prompting
Three of the four outputs remained predominantly Western or Europe-first. Only Claude systematically represented Africa, the Americas, Asia, and the Middle East alongside Europe.
Practical Recommendation by Use Case
Research and Education
Use Claude
Best when accuracy, depth, and global representation matter more than quick image aesthetics. Strongest fit for explainers, teaching material, and documentation.
Presentation-Friendly Static Graphic
Use Gemini
Best when you want a clean infographic format that a broad audience can absorb quickly, provided you are willing to verify details and expand the global scope.
Decorative Historical Art
Use ChatGPT carefully
Best for mood, style, and visual impact. Not a safe choice for factual diagrams unless every date, label, and event placement is manually checked.
Information-Dense Diagrams
Avoid Grok for now
The current text-rendering quality is too weak for serious timeline communication. It may work better for icon-led concepts than label-heavy historical visuals.
Bottom Line
This test makes one thing very clear: visual AI performance is not only about image quality. It is about format choice, factual fidelity, legible text, and whether the output actually functions as a diagram once the novelty wears off.
Under a single first-pass prompt with no refinement, Claude showed a clear advantage for this kind of historical communication task. Gemini was the best compromise if a static image was required. ChatGPT was visually impressive but too error-prone to trust uncritically. Grok needs better text reliability before it can be recommended for information-dense timeline work.