
The US and China are racing to lead artificial intelligence. The cash-flow statement appears to have entered as an independent candidate.
That is the uncomfortable backdrop to China’s technology selloff. At the 29 October close, Shanghai’s STAR50 finished at 1,228.09, down 4.27%. A rebound the previous day had not held. Xinhua Finance’s closing report confirms the finish, rather than the midday figure circulating in earlier coverage.
This is a sharemarket reckoning. It is not evidence that useful AI stopped working overnight.
First, which bubble are we talking about?
On 26 October, Reuters reported a roughly 40% STAR50 decline in less than four months and about US$480 billion erased in market value. Those are dated reported estimates, not our calculation of today’s losses. A market-value markdown is not cash withdrawn from company bank accounts.
STAR50 is a technology-board equity index, not a census of every Chinese AI business. Chipmakers, optical suppliers and robot manufacturers also sell different things. Treating them as one company called “China AI” makes for a tidy headline and terrible accounting.
The latest completed mainland session checked here is 29 October, ending at 15:00 China Standard Time, or 17:00 AEST. Reporting was checked on 30 October while that day’s Asian sessions were still open. October 30 closing results are not included.
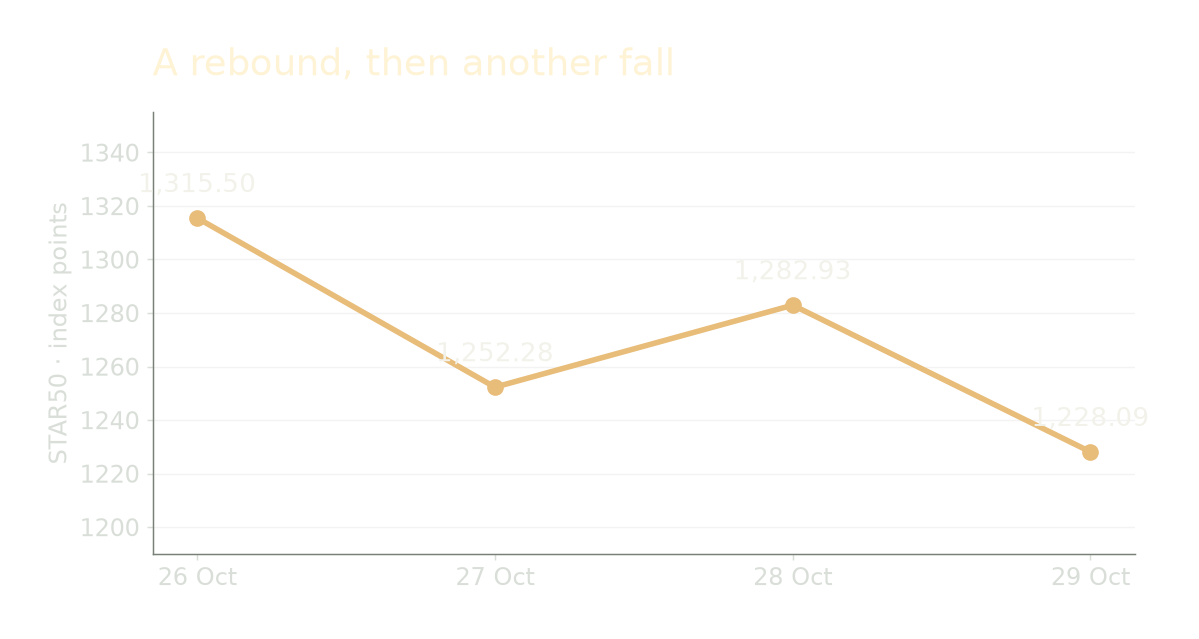
Read or download the chart data
| session date UTC+08 | close index points | daily change percent |
|---|---|---|
| 2026-10-26 | 1315.5 | -2.23 |
| 2026-10-27 | 1252.28 | -4.81 |
| 2026-10-28 | 1282.93 | 2.45 |
| 2026-10-29 | 1228.09 | -4.27 |
Big expectations meet actual companies
The damage is uneven, and the earnings are more interesting than a blanket obituary.
Unitree, the robot maker listed as Yushu Technology (Shanghai: 688836), reported quarterly revenue of RMB665 million, up about 70%, while attributable net profit fell 17.4% to RMB112.7 million. R&D spending rose sharply. Reuters’ 28 October report also described a substantial recent share-price rebound after an earlier slump. “It halved” is not a permanent condition.
Optical supplier Zhongji Innolight (Shenzhen: 300308) offers a different picture. Its unaudited third-quarter filing, reproduced by Sina, reports revenue up 171.83% and attributable net profit up 173.74%. Those are company-wide quarterly results, not isolated AI revenue.
Strong growth can coexist with a falling valuation. If investors originally paid for an even more spectacular future, merely spectacular results can still disappoint.
Nobody found a single big red button
Reuters’ October 26 investigation identified no obvious single trigger. Traders cited expensive shares, tax bills and fears about restrictions on Chinese equipment reaching overseas data centres. Those are attributed explanations, not proof that one new rule caused the whole fall.
Competition and future price pressure matter too, but should not be presented as an already measured collapse in every supplier’s margins. Policy uncertainty, crowded positioning and disappointing returns can reinforce one another without sharing one cause.
Beijing would like domestic technology champions. Washington would like technological leadership. Investors would quite like both sides to remember the bit where someone earns money.
America has the same question, not the same companies
The US is not automatically next in a queue outside the crash department. Its largest cloud companies have established businesses generating substantial cash. That is a meaningful difference from a speculative manufacturer valued mainly on future scale.
It is not an exemption from arithmetic.
For the quarter ended 30 September, Microsoft’s release reports US$58.0 billion in operating cash flow and US$39.367 billion in cash additions to property and equipment. The difference is US$18.633 billion.
Alphabet’s SEC-filed release records US$42.290 billion and US$51.355 billion respectively: a US$9.065 billion free-cash-flow deficit. Google Cloud revenue nevertheless grew 103%, across AI infrastructure and solutions, core services and TPU system sales.
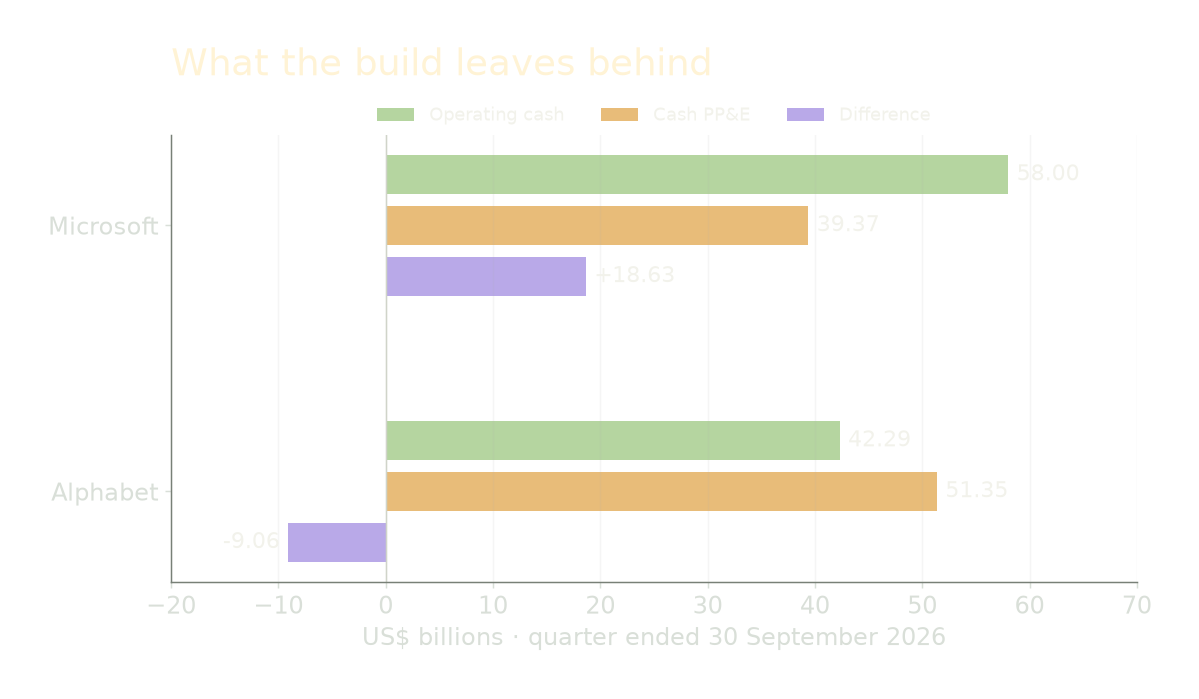
Read or download the chart data
| company | operating cash flow USD bn | cash PPE USD bn | OCF less cash PPE USD bn |
|---|---|---|---|
| Microsoft | 58.0 | 39.367 | 18.633 |
| Alphabet | 42.29 | 51.355 | -9.065 |
These are company-wide cash figures, not a cleanly disclosed “AI spending” budget. This compares the reported cash-flow-statement lines, not every form of capital investment. Mixing cash purchases with a headline capital-expenditure number that includes leases would muddy the story.
Amazon reinforces the tension. Its latest release reports AWS quarterly sales growth of 39%, alongside a US$42.4 billion free-cash-flow outflow over the trailing twelve months. That longer period is deliberately outside our quarterly chart.
Demand can be genuine while the cost of serving it becomes uncomfortable. Both things can happen before breakfast.
How the wobble could travel
The first transmission channel is expectations. Investors elsewhere may demand stronger evidence before paying extraordinary prices for another chip, cloud or robotics story.
The second is spending. If major customers delay orders, suppliers in Taiwan, South Korea, Japan and beyond could feel it. Data-centre contractors and power developers could face slower commitments too. That is a plausible chain of events, not evidence those cancellations have already occurred.
The third is funding. Falling shares become a broader financial problem if they interact with collateral calls, expensive refinancing, lender losses and forced selling. Correlated red charts alone do not establish that chain.
For Australia, the questions are practical: who is financing local data centres, how firm are the customer commitments, and who carries the cost if projected demand arrives late?
Neither a flag on the server rack nor an announcement about “sovereign AI” answers those questions. National ambition is not a payment method.
The technology is not its share price
Rising cloud revenue and profitable suppliers argue against declaring demand dead. Lower valuations could also let viable businesses raise money on more realistic expectations, although weaker firms may find funding harder.
Cheaper, more efficient inference could expand useful adoption. It could also change who captures the profit. That connects directly to our earlier argument for better computing, rather than simply bigger hardware bills.
That is a more interesting contest than deciding which country wins the most expensive ribbon-cutting ceremony.
Conclusion: watch the receipts
Over the next 30 to 90 days, watch cash spending against operating cash generation; earnings and margin revisions; financing costs and customer concentration; and whether promised orders turn into paid usage. Depreciation assumptions deserve scrutiny alongside cash flow, because spreading an asset’s cost over more years does not fund its purchase.
Stabilising prices, durable margins and funding that remains available would support a reset. Order cuts, widening credit stress and forced asset sales would make the spillover case stronger.
China’s selloff does not settle whether AI will change the world. It asks how much investors should pay today for profits that might arrive years from now.
The US–China race can keep its ambition. Someone should still keep the receipt.
Sources and reporting limits
Research checked 30 October 2026, 11:49 AEST. The Asian sessions were ongoing; the price chart ends at the completed mainland session of 29 October. This is reported analysis, not an original trading study or price forecast. Primary company releases are distinguished from Reuters reporting and financial-portal reproductions. Direct Unitree filing and a common four-index historical series were not independently retrieved. AI tools assisted research and drafting, with source checks and human editorial approval before publication. Drawings are original illustrations; charts use cited figures.